- 42DM's GTM Benchmark Report
We Audited 100 AI Products.
Here’s Which GTM Activities Correlate with Revenue.
- Marketing strategy, GTM, AI infrastructure companies
Get access now⚡
Find Out Whether You’re Building the Right GTM for Your Stage
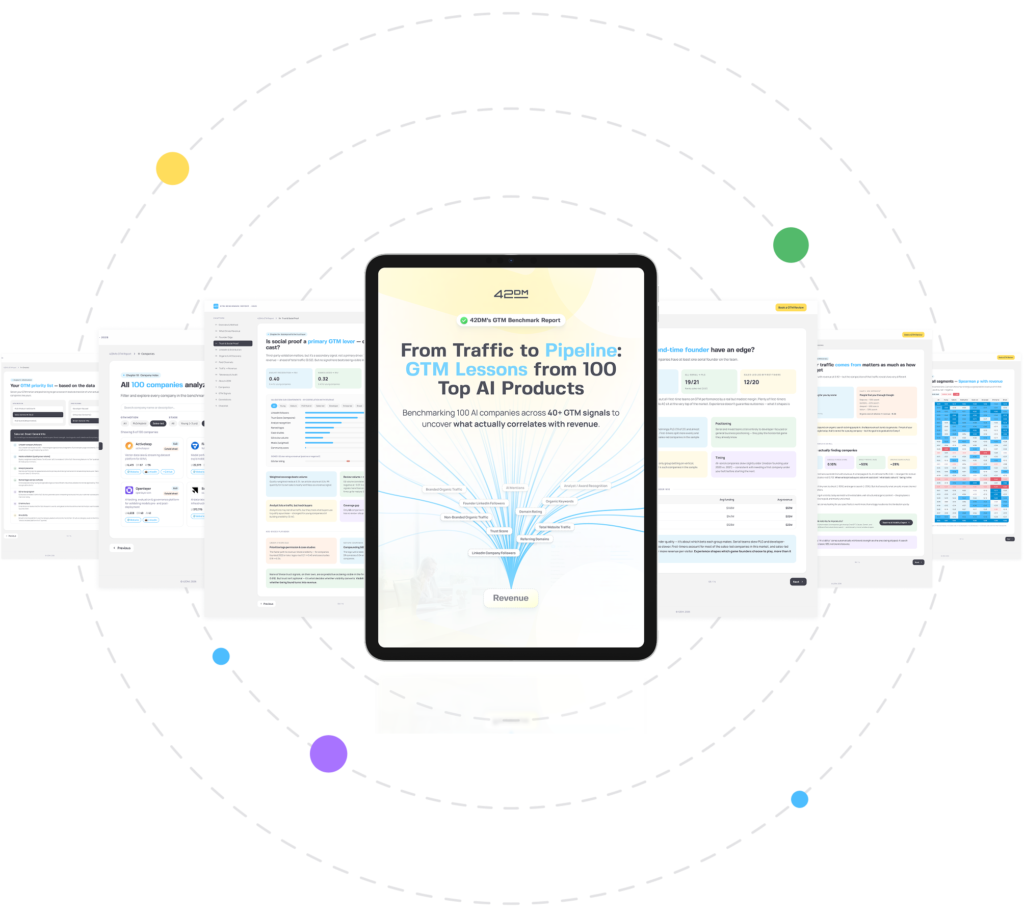
A revenue-correlated view of 40+ GTM signals. We audited LinkedIn reach, search authority, AI mentions, paid distribution, trust assets, open-source activity, traffic, and more.
A practical GTM formula. Learn why high visibility without proof, or strong proof without distribution, does not reliably create pipeline.
The young-company playbook. For these, trust, named customer logos, founder visibility, and paid distribution correlate more strongly with revenue than search authority or organic traffic.
The established-company playbook. For these, LinkedIn, domain rating, referring domains, total traffic, organic traffic, and AI visibility become stronger revenue signals as compounding assets begin to pay back.
The PLG versus sales-led split. PLG and hybrid companies earn trust through product and practitioner adoption. Sales-led companies rely more heavily on LinkedIn presence, AI mentions, organic visibility, and independent media validation.
What's Inside this Research

- Audited 100 B2B AI product and infrastructure companies, including orchestration platforms, agent frameworks, LLM infrastructure, vector databases, MLOps tooling, observability platforms, and developer tools.

- Analyzed public signals across LinkedIn reach, search visibility, website authority, AI mentions, media and analyst validation, customer proof, paid distribution, open-source activity, and post-click conversion. We then split the data by company age, GTM motion, positioning focus, and target buyer.

- Used Spearman rank correlation against reported revenue to identify the signals that consistently move with growth, overall and by segment. This is designed to reveal where your GTM is underbuilt, overfunded, or following the wrong playbook for its stage.